
ELECTRIC ICARUS PROJECT / NOVA ACADEMY / FOUNDATIONS OF INQUIRY
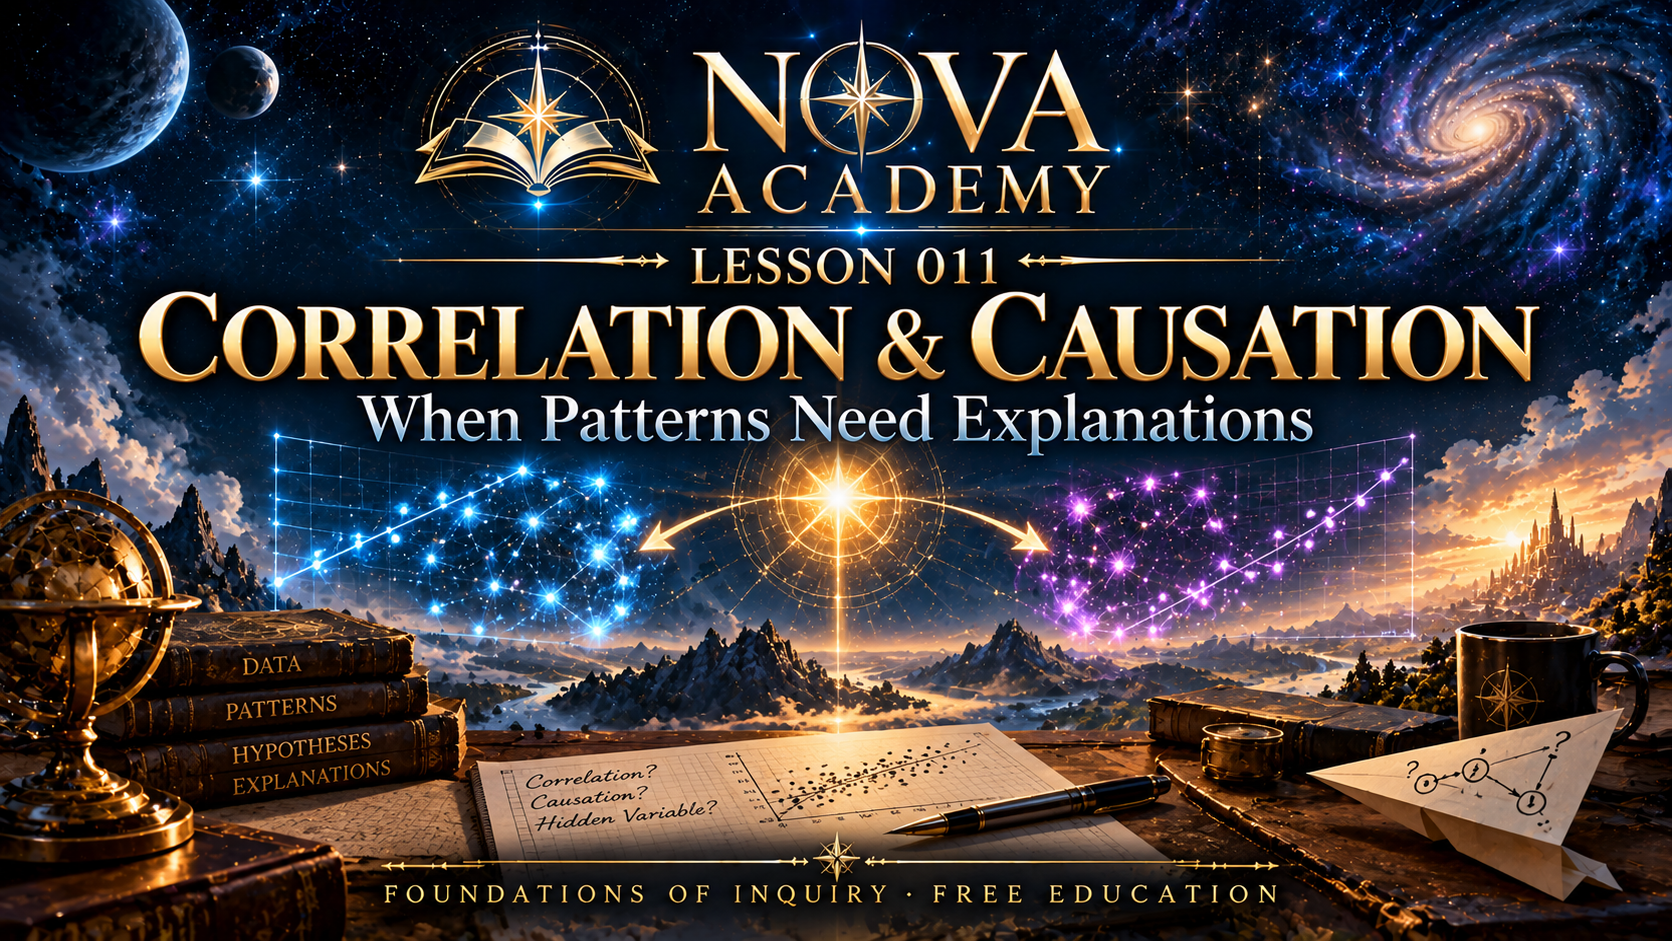
LESSON 011 · CORRELATION & CAUSATION
When Patterns Need Explanations
When two things change together, have we discovered a cause—or an interesting clue? Learn how to investigate the difference between association and causal explanation.
FREE · BEGINNER · 45–55 MINUTES · NO ENROLLMENT · OCTOBER 30, 2026
What you need: paper and a pencil. For the optional hands-on experiment: two paper airplanes, a coin, and a way to measure distance. A paper-only alternative is included.
Previously: Lesson 010 — Uncertainty.
A pattern is the beginning of a question
Suppose ice-cream sales and park visits both increase in the same weeks. Perhaps ice cream encourages visits. Perhaps the park sends people toward ice cream. Or perhaps warmer weather makes both more likely. Observing two rising numbers does not tell us which explanation is right.
Our previous lesson was about uncertainty. This one asks how to investigate a proposed cause without confusing a compelling story with evidence.
By the end of the lesson, you can:
- Define correlation and distinguish it from a causal claim.
- Identify positive and negative associations, as well as a possible third variable.
- Sketch a common-cause diagram using three variables.
- Ask a counterfactual question about what would happen under a different condition.
- Calculate and interpret simple experimental averages.
- Explain the purpose and limitations of comparison groups, random order, and repeated trials.
1. Correlation describes how observations vary together
Two variables are positively associated when higher values of one tend to accompany higher values of the other. A negative association means higher values of one tend to accompany lower values of another. A weak linear association does not rule out more complicated relationships.
For numerical data, a Pearson correlation coefficient between −1 and +1 describes the direction and strength of a linear relationship. It does not identify which variable caused the other, if either did.
Three descriptions—not three verdicts
- Positive: as A gets larger, B generally gets larger.
- Negative: as A gets larger, B generally gets smaller.
- No clear linear trend: the plot lacks a straight-line pattern, but other patterns might remain.
Read OpenStax Psychology 2e, Analyzing Findings for examples of scatterplots and correlation.
2. Causal explanations propose what produces a change
A causal question asks whether changing A would change B under appropriately comparable circumstances. We can draw A → B to record that hypothesis. But the arrow is a proposed relationship; drawing it does not prove it.
Four possibilities worth checking
- A influences B.
- B influences A (reverse causation).
- Some other factor C influences A and B (a common cause).
- The apparent relationship involves coincidence, selection effects, error, or interacting mechanisms.
3. Find the hidden third factor
For the park example, draw two arrows on paper: Warmer weather → Ice-cream sales and Warmer weather → Park visits. Now consider whether temperature could explain part or all of the association. A variable that distorts the interpretation of a suspected cause and an outcome can be a confounder.
This diagram represents a possible mechanism, not verified measurements from a real town. Holidays, tourism, school schedules, or publicity might also matter.
Three questions for your field notes
- What two variables appear associated?
- What third factor might affect both?
- What new information could distinguish the proposed explanations?
4. Counterfactuals and fair comparisons
A counterfactual question asks: “What would the outcome have been if the suspected cause had been different, with the relevant circumstances otherwise comparable?” We cannot ordinarily observe both possibilities for the same event at the same instant.
Researchers address this difficulty through carefully designed experiments, comparison groups, repeated measurements, and observational causal-inference methods. Random assignment reduces systematic differences on average; it does not make one small test infallible.
The NIST Engineering Statistics Handbook explains the difference between an observed correlation and a causal relationship.
5. Mini-lab · Two paper airplanes, one question
15–20 MINUTES · PAPER EXPERIMENT OR DATA-ONLY OPTION
The suspected cause is wing design, while the outcome is flight distance. Make two planes using different designs. Use the same paper type, launch line, and thrower. Select an unobstructed indoor space, safely away from other people and breakable objects.
- Before testing, write your prediction and why you think it may be true.
- Flip a coin to determine whether A or B goes first in each pair of trials.
- Measure five throws of each design; record every attempt, even the disappointing ones.
- Calculate the mean of the five distances for each plane.
- Identify three possible alternative influences, such as throwing force, folding differences, air flow, or measurement error.
- Explain how you could improve the reliability of the comparison.
You can skip physical throws and work with these invented classroom data. They are not real experimental observations:
| Plane | Five distances in meters | Mean |
|---|---|---|
| A | 3.1, 3.0, 3.2, 3.3, 3.0 | 3.12 |
| B | 3.4, 3.1, 3.5, 3.3, 3.2 | 3.30 |
Worked answer
A: (3.1 + 3.0 + 3.2 + 3.3 + 3.0) ÷ 5 = 3.12 m.
B: (3.4 + 3.1 + 3.5 + 3.3 + 3.2) ÷ 5 = 3.30 m.
B’s mean exceeds A’s by 0.18 m in this fictional data. That does not by itself prove the design caused the difference or that B will always fly farther.
6. Improve the experiment
Suppose all five A throws occur before all five B throws. The thrower may improve with practice or tire over time. Randomizing the order helps prevent one design from systematically benefiting from its position in the session.
Other improvements include more trials, consistent folding measurements, a clearer distance-measurement rule, and repeating the comparison with other throwers. Even careful small experiments must report their uncertainty.
Change one feature at a time
Choose one improvement to the procedure. Explain which alternative explanation it tries to limit, and what still cannot be concluded even after the improvement.
NIST also describes randomized block designs for situations in which nuisance factors such as operators or testing conditions matter.
7. What if a controlled experiment is impossible?
Some causal questions cannot be answered by assigning people or environments randomly. Certain experiments are unethical, expensive, or impossible. Observational studies, natural experiments, and other methods can still contribute causal evidence when their assumptions and alternative explanations are examined carefully.
Therefore, “correlation is not causation” is a warning against an unsupported leap, not a declaration that causal knowledge can never come from observational research.
8. Audit a causal headline
Find a public headline claiming something “causes,” “prevents,” “improves,” or “reduces” another outcome, or invent a fictional headline for this exercise. Then record three separate statements:
Field-note template
- Observed: What was measured or actually reported?
- Proposed: What causal story is being offered?
- Uncertain: What other explanation or missing measurement needs attention?
Avoid collecting private information or experimenting on other people. Keep the investigation to public sources or imaginary classroom examples.
9. Questions, interpretations, and the next model
A satisfying story can connect two dots. A careful explanation must survive comparison with plausible alternatives. Nova Academy treats that discipline as a foundation of inquiry: be imaginative in what you propose and precise about what has been established.
The previous ten lessons give us the tools to ask good causal questions: observe, test, verify, define, model, study feedback and emergence, examine connections, adapt, and report uncertainty.
10. Knowledge check
- Do two variables rising together establish that one caused the other?
- What could temperature explain in the park-and-ice-cream example?
- What does a counterfactual question compare?
- Why randomize the order of paper-airplane throws?
- What is actually supported by the invented A and B data?
- Can careful observational studies contribute to causal understanding without randomized experiments?
Answer key
1. No; association alone does not establish causation. 2. A shared influence on both activities. 3. Outcomes under different conditions for otherwise comparable cases. 4. To reduce systematic order effects. 5. B has a 0.18-meter higher invented sample mean, not proven causal superiority. 6. Yes, with suitable methods, assumptions and limits.
Reflection · When patterns need explanations
You can see a real pattern and still be mistaken about its source. The goal is not to become suspicious of everything. It is to remain curious enough to investigate the explanations that a pattern permits.
Takeaway: Name the association. Propose competing causes. Seek a fair comparison. Calculate carefully. Describe what the evidence does—and does not—show.
Completion: Identify a potential confounder, calculate both sample means, and explain one limit of the proposed causal claim. No tuition, enrollment, grades, or certificate required.
Sources & further learning
- OpenStax Psychology 2e — Analyzing Findings.
- NIST — Experiments and Experimental Design.
- NIST — Randomized Block Designs.
← Review Lesson 010 · Browse the Eleven Lessons · Visit the Quantum Atrium
Nova Academy is a free, non-accredited educational initiative of the Electric Icarus Project. The paper-airplane measurements are fictional teaching data, not published experimental findings.

